Autopsy: the 3 November 2026 general election against the forecast
Loading the autopsy…
The race for governor
The legislature
Every office against its published forecast
| office | result: Democrat | result: Republican | result margin | published: Democrat | published margin and range | the Democrat against the forecast | inside the range? | ticket lag: the Republican against the governor | the same gap in 2022 / 2018 |
|---|
The maps: every race, the split fill, the best Democrat, the county pies and turnout by party
How every county voted, and every precinct
The still image, by county (PNG, light and dark)
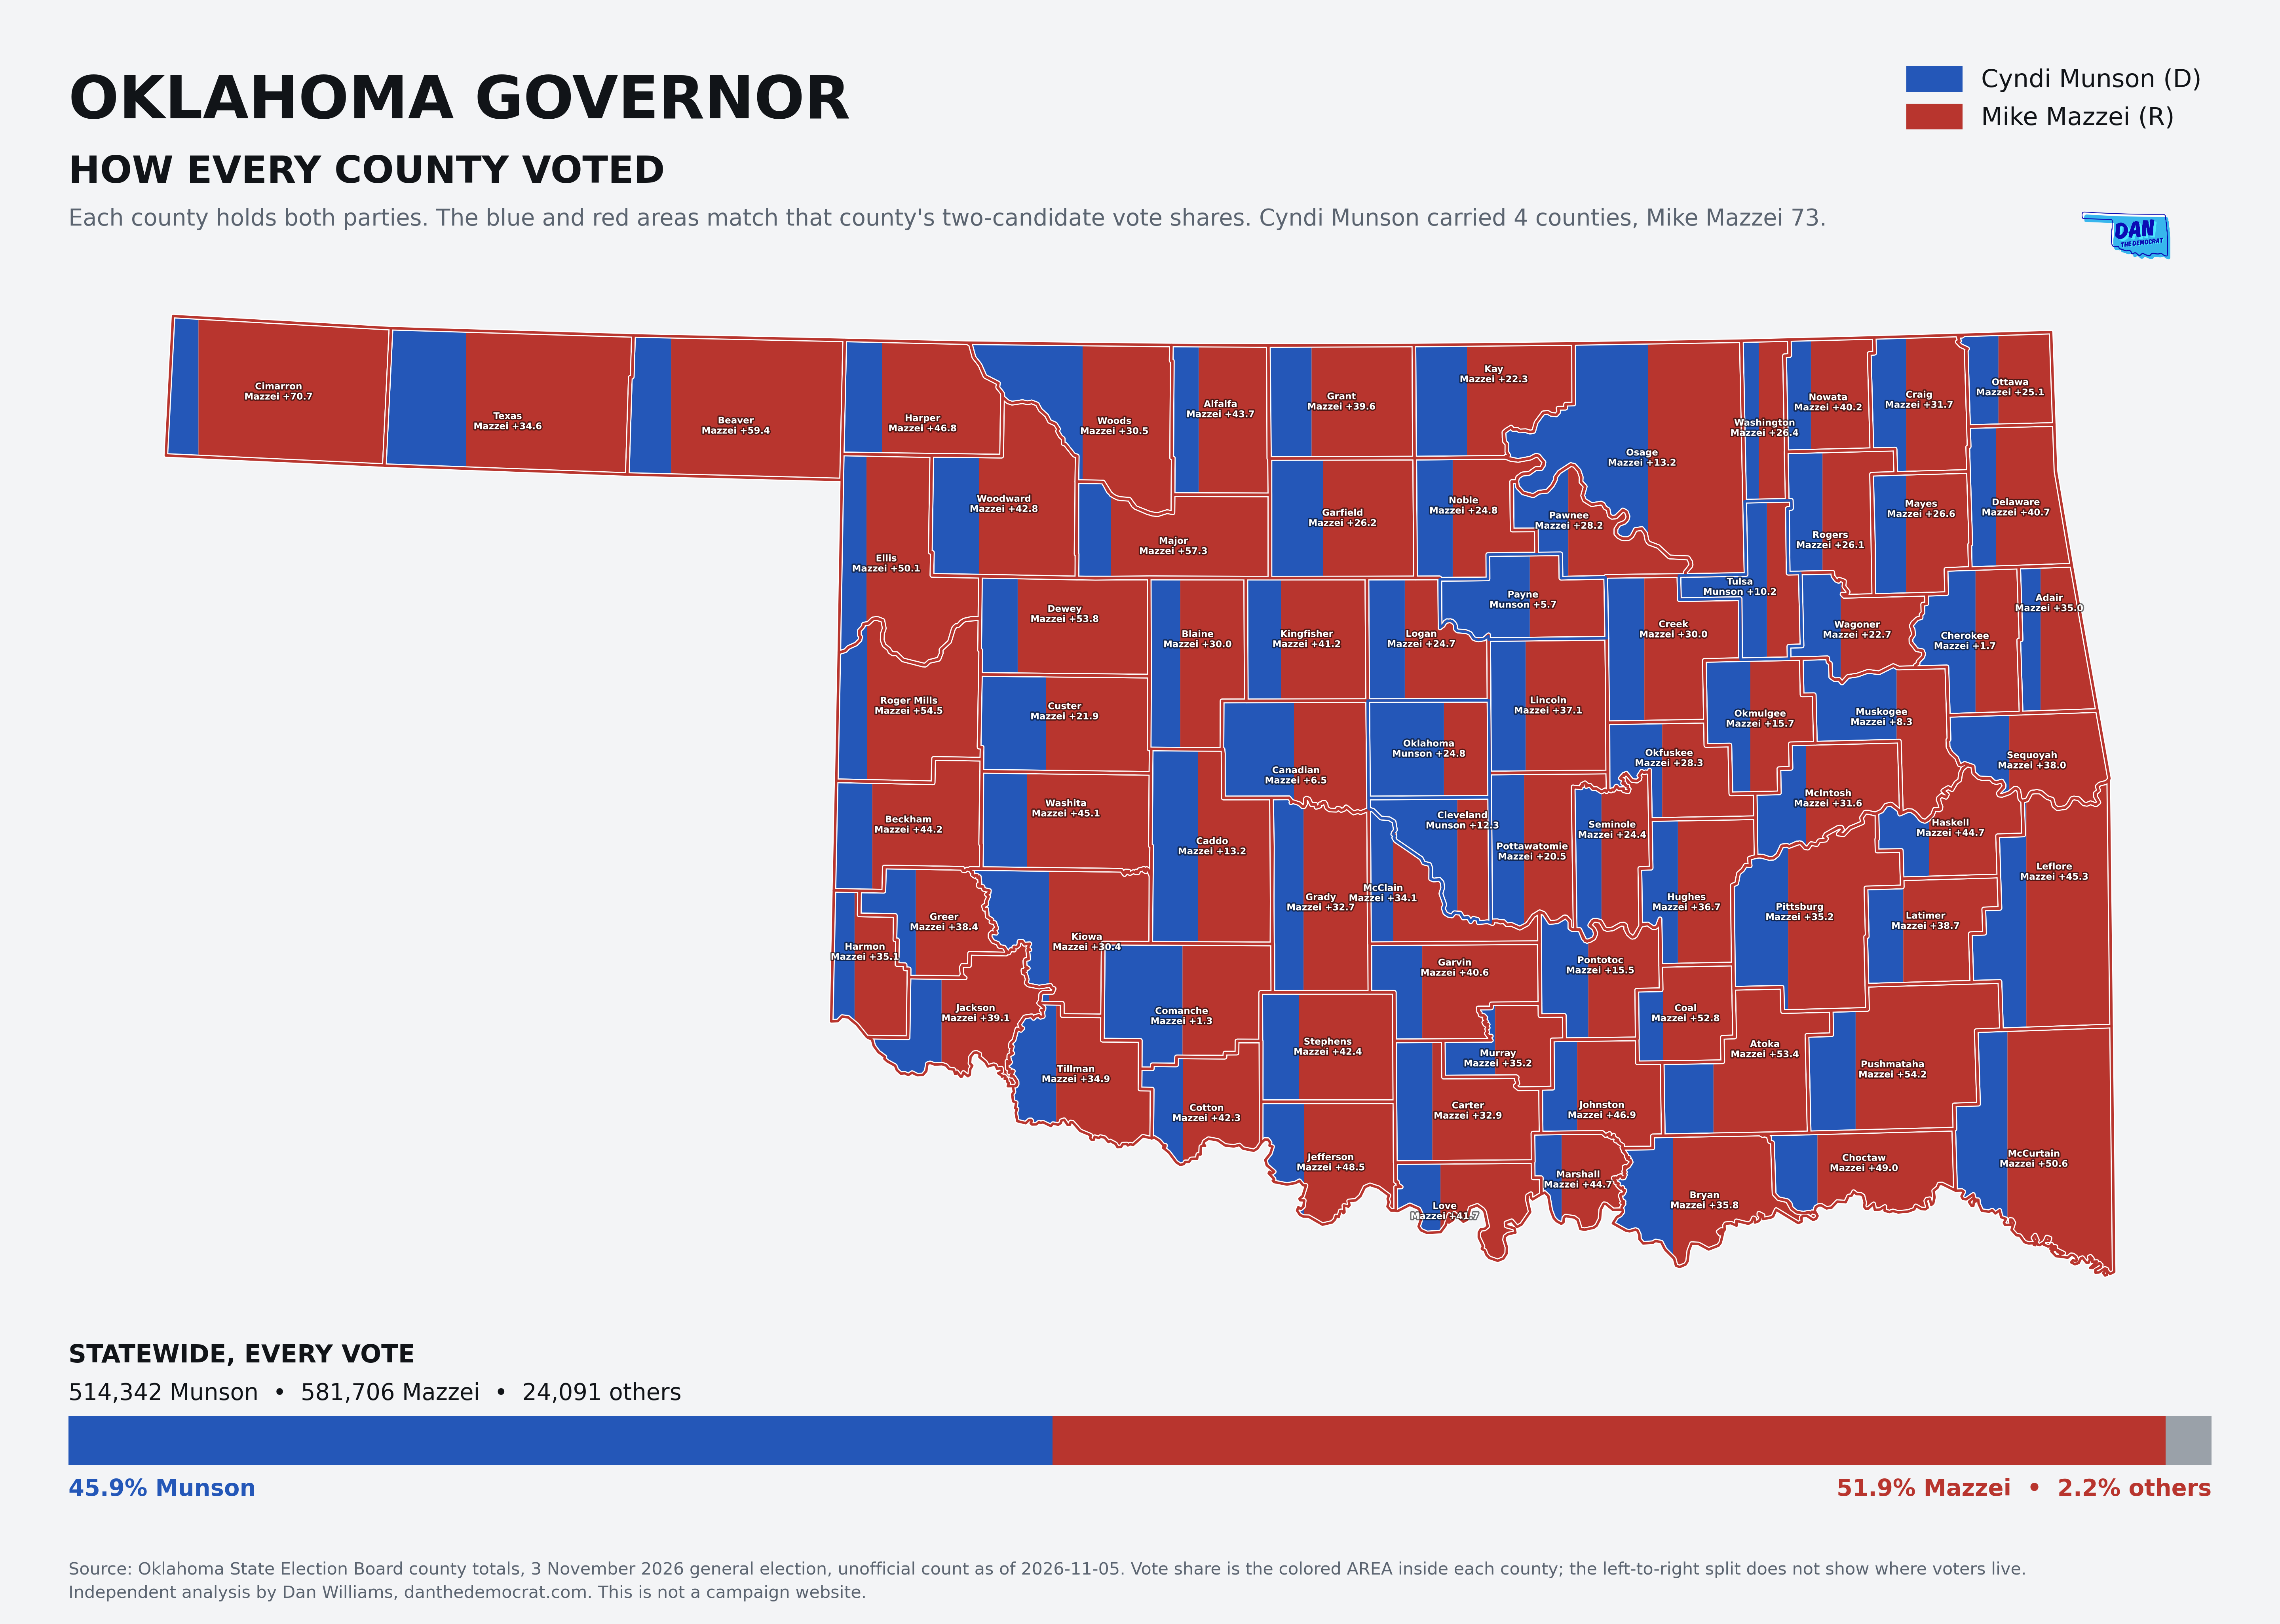
The best Democrat in each precinct
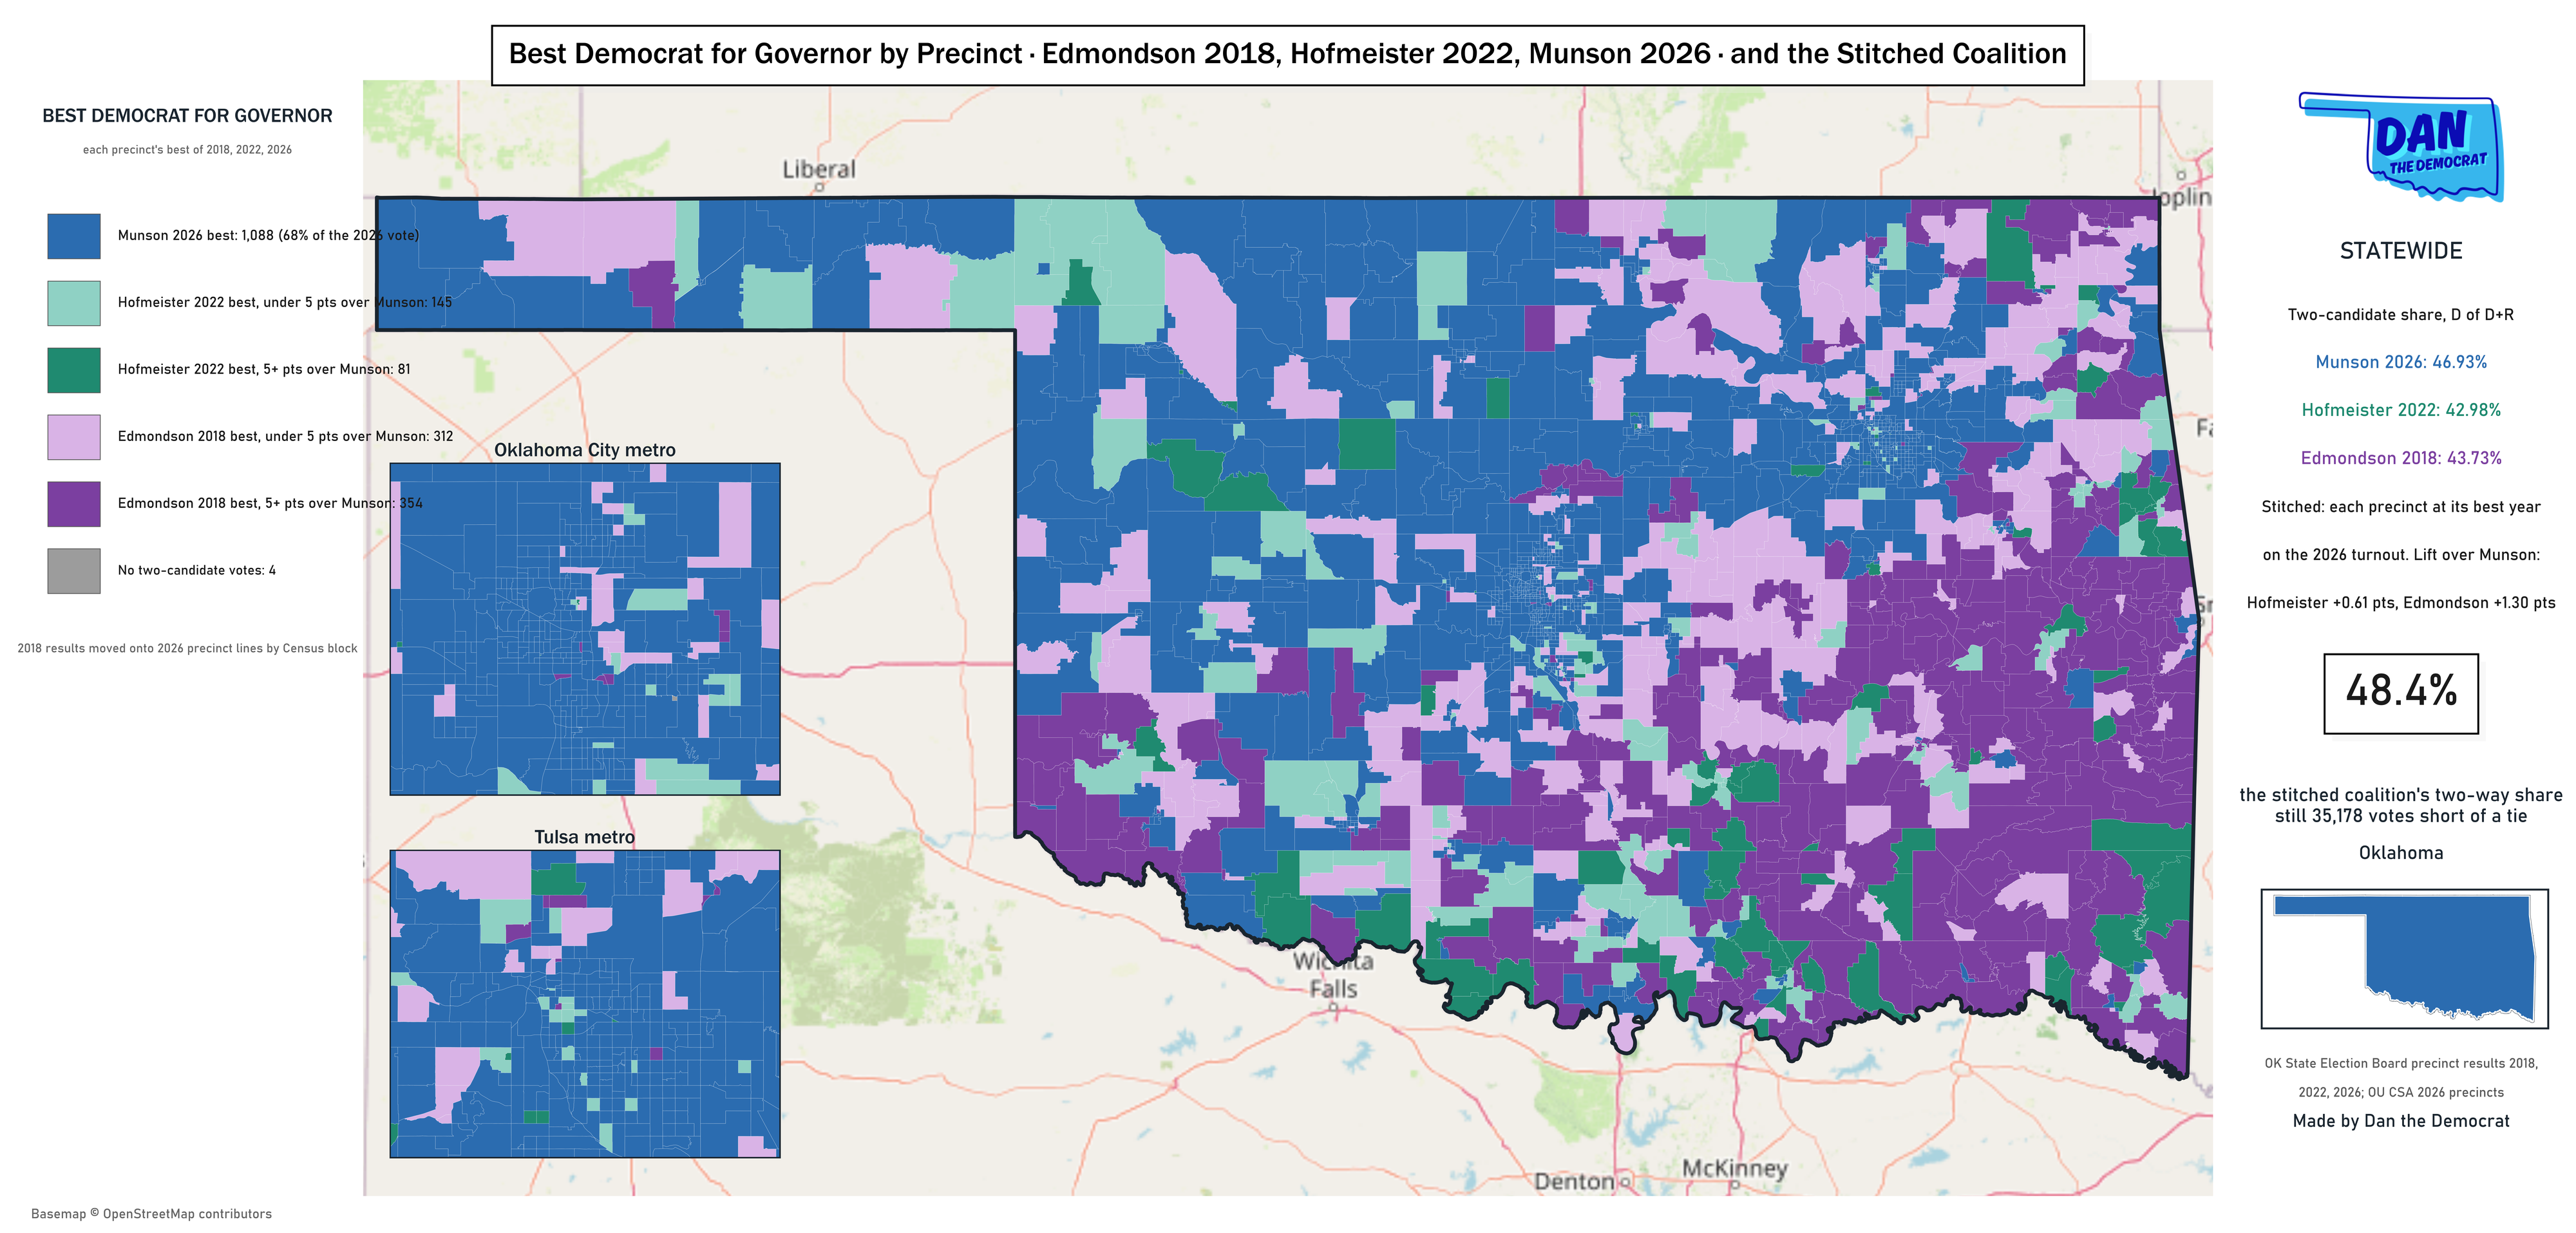
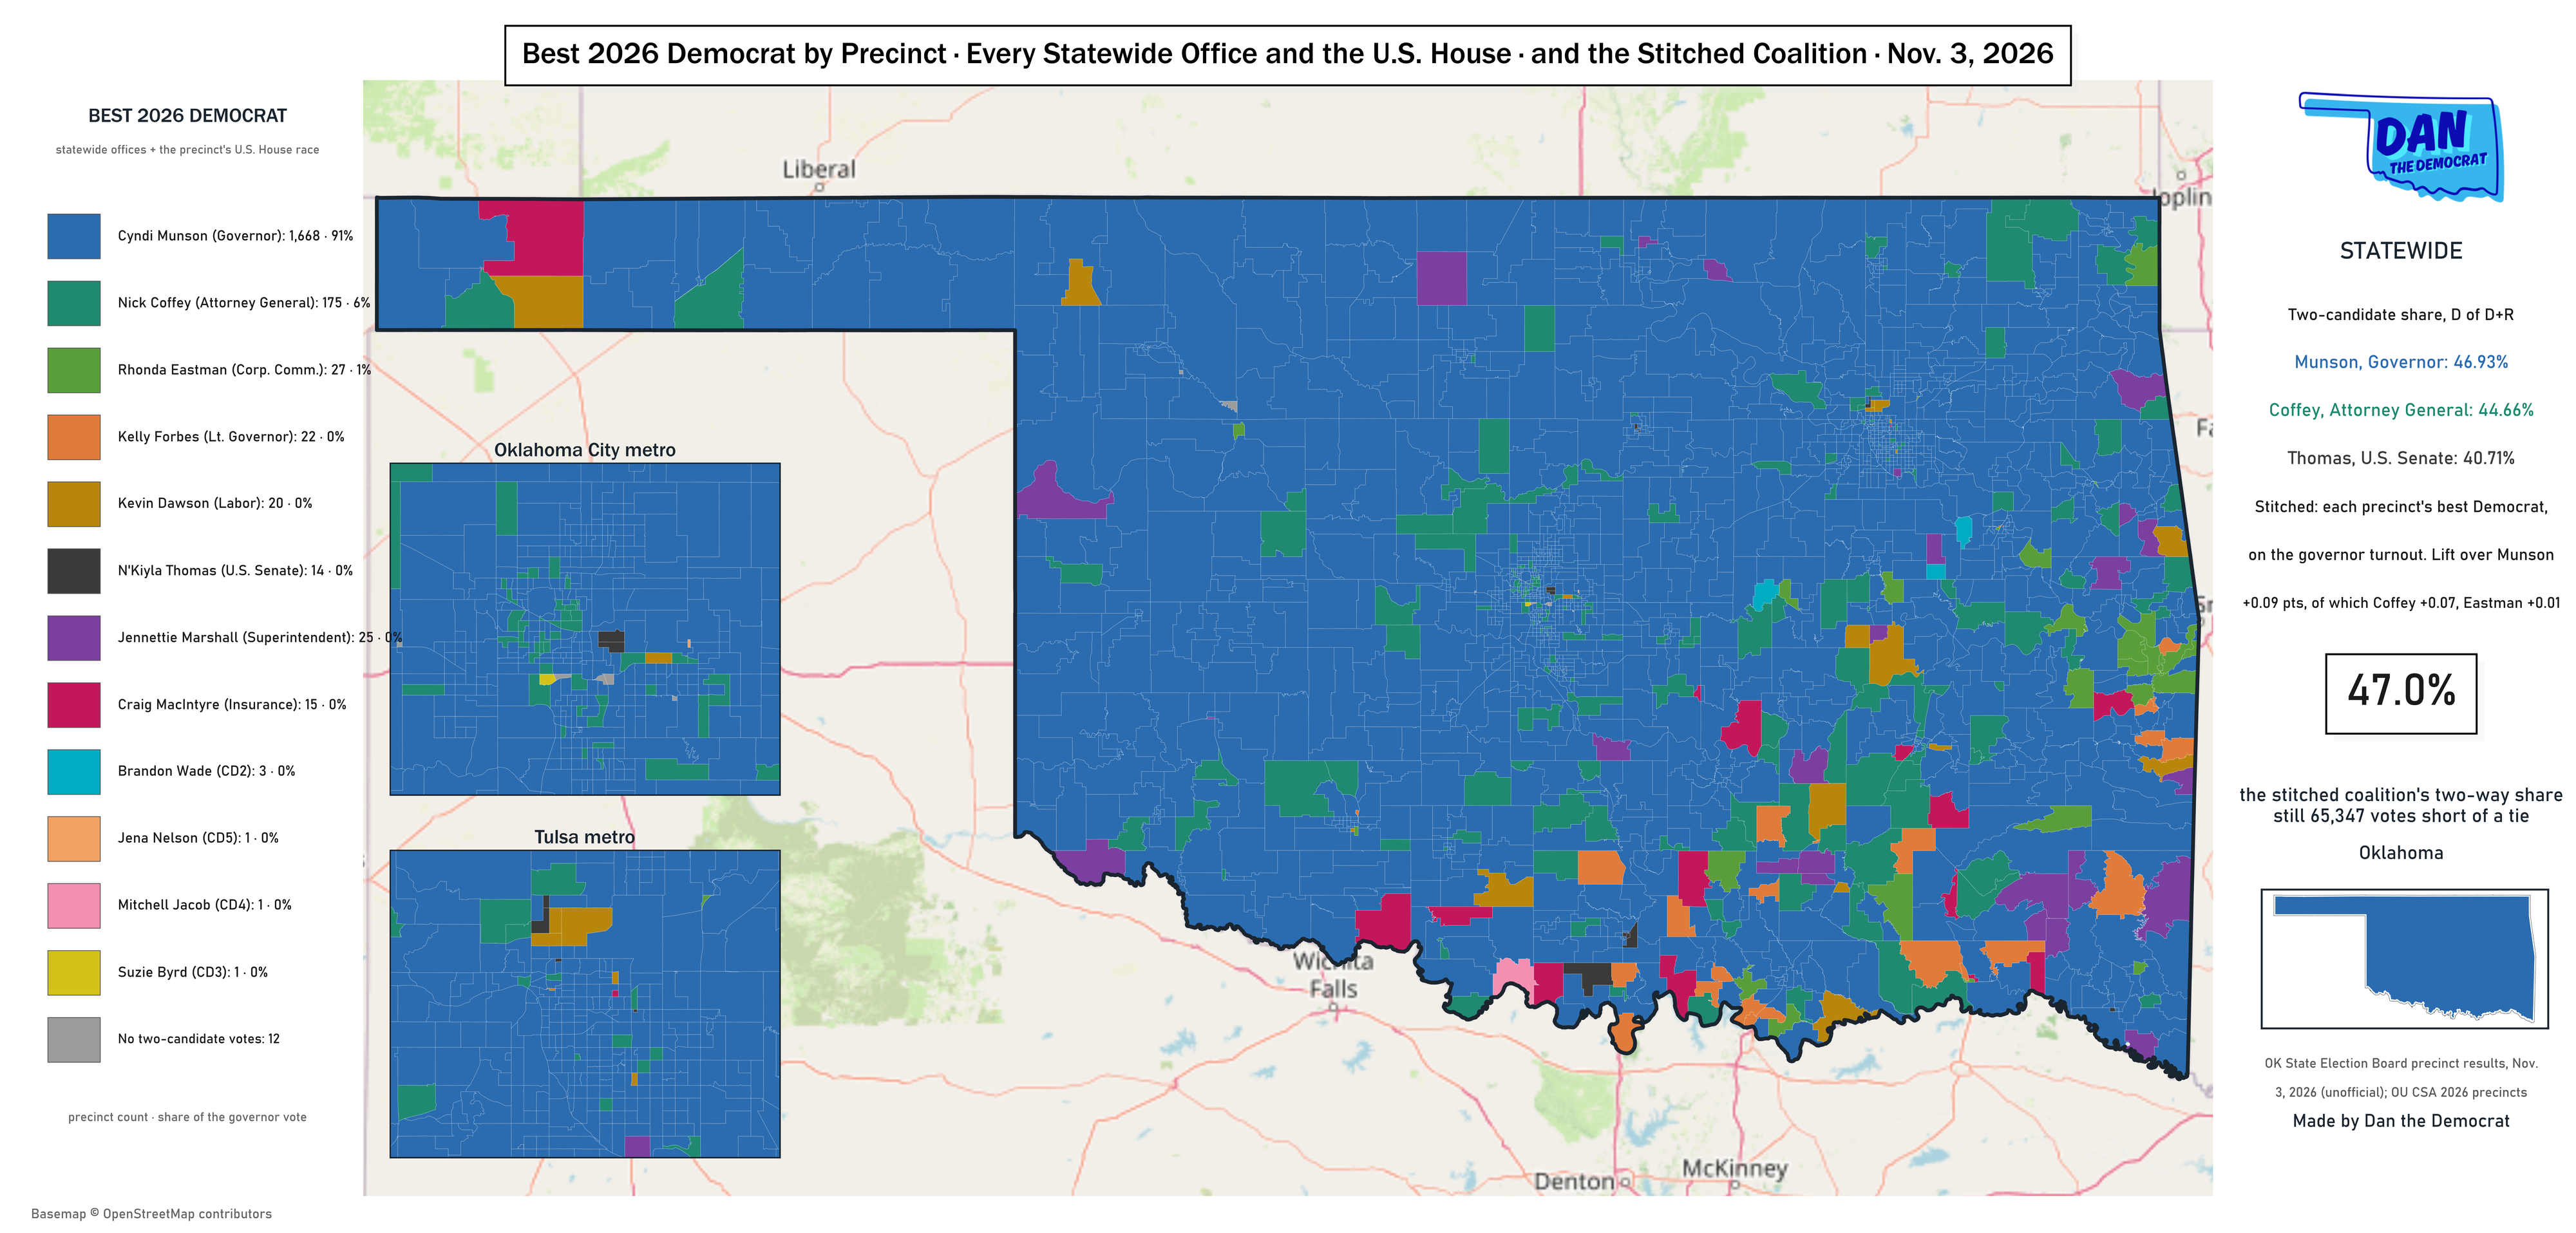
The still images (PNG, 4,000 pixels wide)
The best Democrat for governor in each precinct: Edmondson 2018, Hofmeister 2022 or Munson 2026
The best 2026 Democrat in each precinct: every statewide office and the U.S. House seat
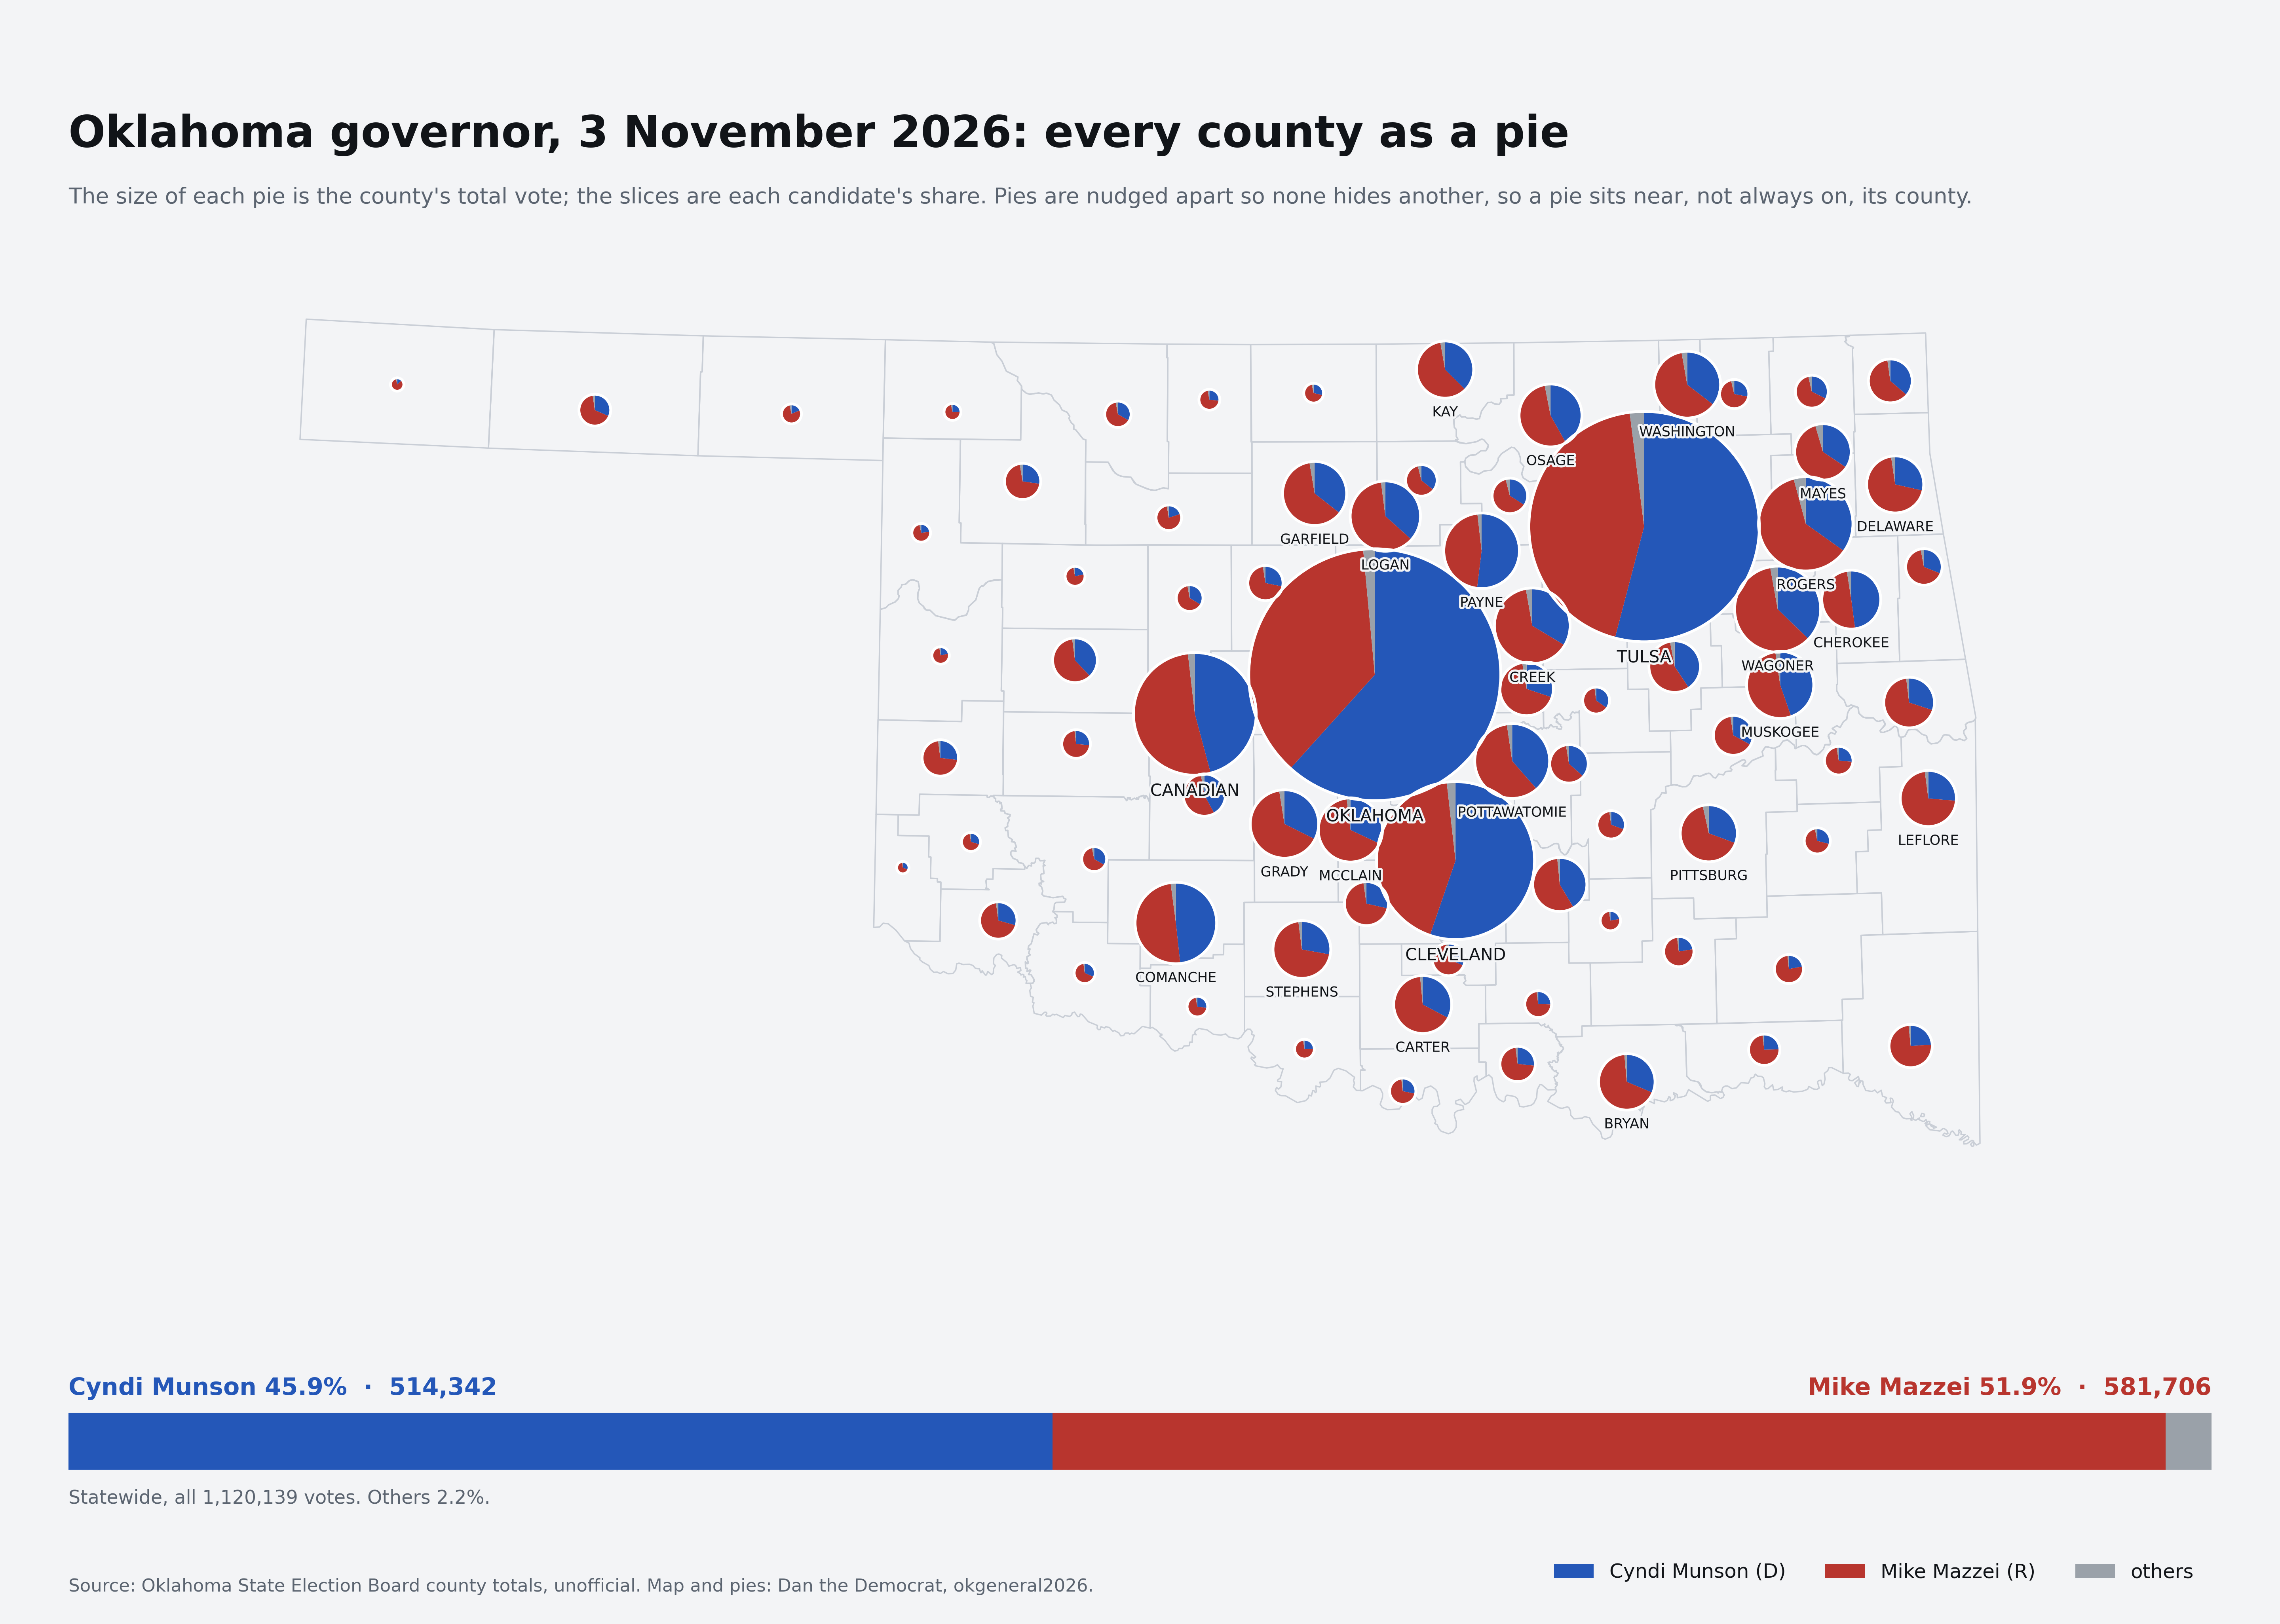
Every county as a pie
Hover or tap a pie for the county’s votes. Scroll to zoom; the pies spread back toward their counties as you zoom in.
The still image (PNG, light and dark)
Turnout by party of registration, county by county
Turnout by precinct: who voted, and for whom
Each precinct is cut left to right. The colored part is the share of its registered voters who voted for governor, blue and red by the candidate; the light gray part did not vote. The outline is the color of the winner there. The left-to-right order does not show where voters live.
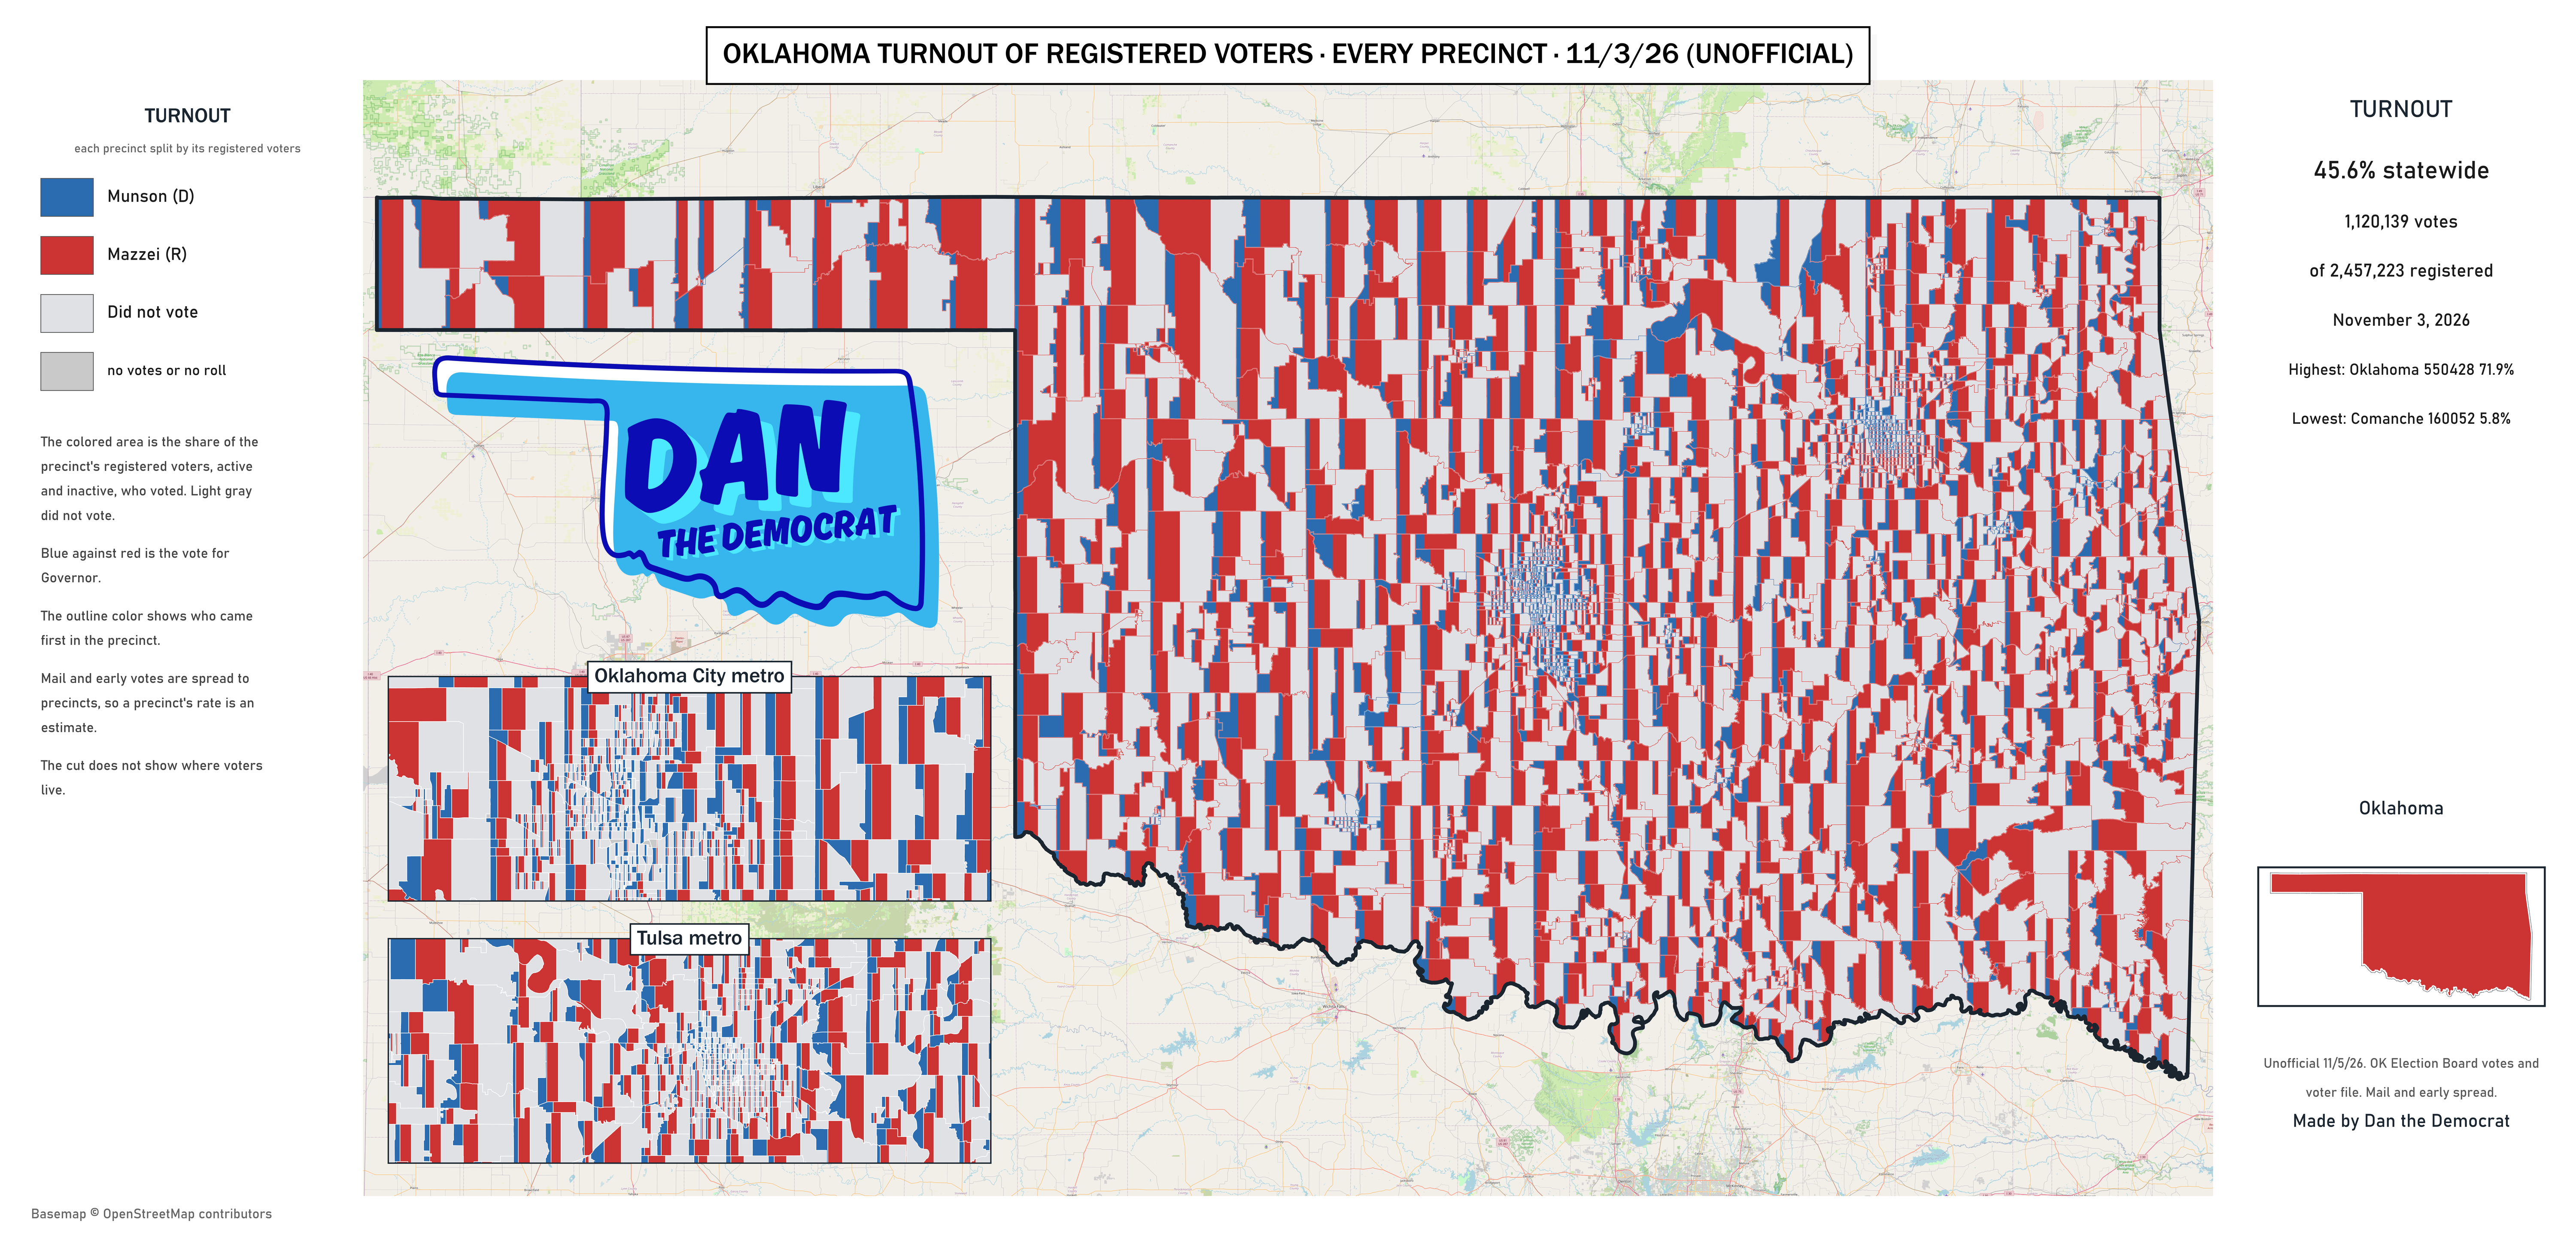
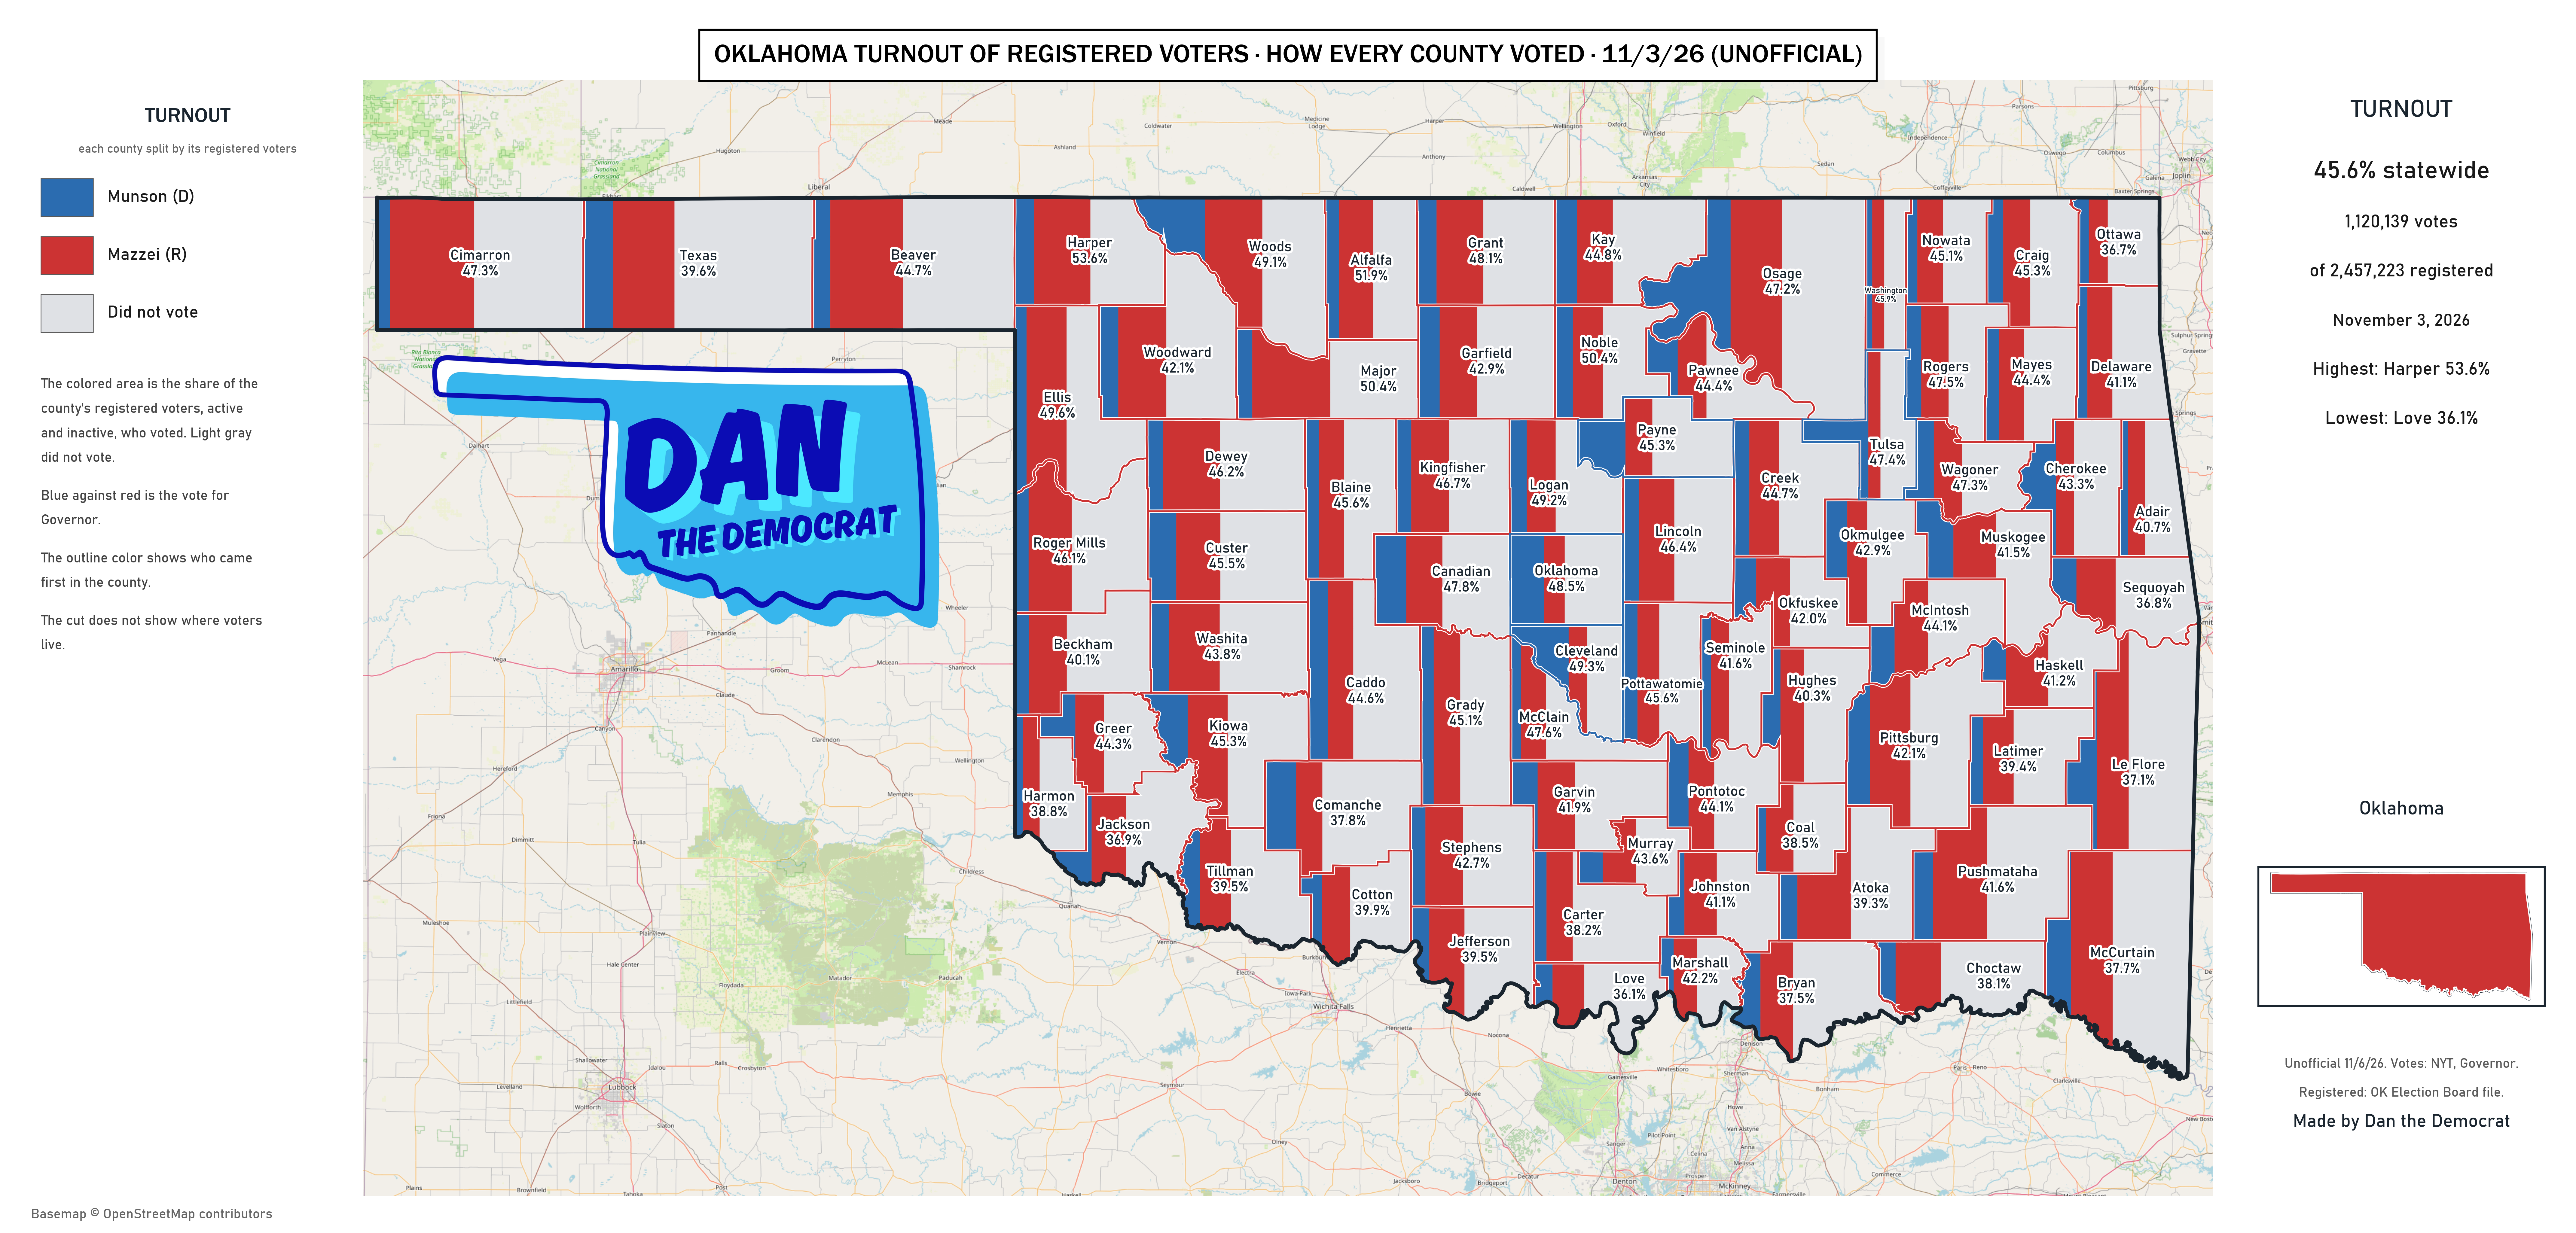
Two bases, both right. This map divides the governor vote by the whole roll, active and inactive together: 1,120,139 votes of 2,457,223 registered, 45.6%. The Turnout view on the Results map, the county table and the turnout section divide by the active roll only: 2,093,684 registered, 53.5%. The Election Board’s own count of registered voters (2,437,803 on 31 Aug 2026) includes the inactive, so this map matches that base. The counties that pool mail and early votes have those votes spread to precincts by each candidate’s election-day vote, so a single precinct’s rate is an estimate. Twelve precincts are solid gray: no votes or no roll. Unofficial results. The figures behind the map: by precinct (CSV) · by county (CSV).
By county
| unit | Democrat 2026 | Republican 2026 | margin 2026 | margin 2022 | swing from 2022 | margin 2018 | swing from 2018 | forecast: Democrat | against the forecast | votes 2026 | votes v 2022 | turnout 2026 |
|---|
Every contested legislative seat, and the U.S. House, against the top of the ticket
| seat | winner | winner's share | Democrat's share | seat margin | governor vote in the seat: Democrat / Republican | the seat against the governor line | governor forecast in the seat: Democrat / Republican | held by | flip? |
|---|
Where Munson carried the seat, and how the Democrat did there
| seat | what happened | Munson’s vote in the seat | seat result | the Republican against the governor line | held by | sitting member on the ballot? | raised: Democrat | raised: Republican |
|---|
Could a stitched coalition win? Every precinct at its best Democratic year
| the vote | Democrat, two-candidate | Democratic votes | Republican votes | short by |
|---|
Drummond’s precincts and Mazzei’s
| precincts by Drummond’s runoff share | precincts | runoff votes | Drummond | Munson 2026 | Hofmeister 2022 | Edmondson 2018 | swing from 2022 | swing from 2018 | Republican votes v 2022 | Democratic votes v 2022 | college share |
|---|
By region: the swing, the forecast and the coalition
The swing from 2022, region by region
| region | precincts | votes 2026 | Munson 2026 | Hofmeister 2022 | Edmondson 2018 | swing from 2022 | swing from 2018 | Republican votes v 2022 | Democratic votes v 2022 | Drummond’s runoff share | against the forecast | best Democratic year | coalition lift |
|---|
How the ballots were cast
| how the ballot was cast | ballots 2026 (share of all) | ballots 2022 (share of all) | Democrat 2026 | Republican 2026 | Democrat 2022 | Republican 2022 | margin 2026 | margin 2022 | change |
|---|
Where the precinct map was right and where it was off
| forecast band: Democrat's share of all votes | precincts | votes | average miss | direction |
|---|
Who voted, by party of registration
| party of registration | voted 2026 | share 2026 | voted 2022, same counties | share 2022 | voted 2018, same counties | share 2018 | 2026 against 2022 |
|---|
How each party’s voters cast their ballot, 2026
| how the ballot was cast | ballots | share of all | Democrats | Republicans | independents | Libertarians |
|---|
The counties that have posted
| county | credits | of the ballot floor | complete? | Democrats 2026 | Democrats 2022 | Republicans 2026 | Republicans 2022 | independents 2026 | independents 2022 | Democratic share 2026 | Democratic share 2022 |
|---|
Turnout, and where the swing came from
By how the precinct voted in 2022
| Democrat’s share of all votes, 2022 | precincts | share of 2026 ballots | ballots v 2022 | ballots v 2018 | Democrat 2026 | Republican 2026 | margin 2026 | swing from 2022 | swing from 2018 |
|---|
By the makeup of the precinct
| precincts | precincts | share of 2026 ballots | ballots v 2022 | ballots v 2018 | Democrat 2026 | Republican 2026 | margin 2026 | swing from 2022 | swing from 2018 |
|---|
Two lenses at once
| row | column | precincts | ballots v 2022 | ballots v 2018 | Democrat 2026 | Republican 2026 | margin 2026 | swing from 2022 | swing from 2018 |
|---|
The lenses together: what holds when the rest are held constant
| measure of the precinct | per | swing from 2022, the rest held constant | swing, this lens alone | ballots v 2022, the rest held constant | ballots, this lens alone |
|---|